
Basic ECG Interpretation
One skill that you will develop as a nurse is how to read an electrocardiogram (ECG) strip. If you are working on a telemetry or critical care unit, this will be a skill that is expected for you to understand. There are a few basics that are important to know before looking at abnormal strips.
What is an ECG?
An ECG records the electrical activity of a patient's heart as it beats. An ECG machine records these different electrical impulses and results in a strip that has the electrical impulses of multiple heart beats.
Basic Terms
There are some basic terms that you will need to understand when discussing an ECG strip. In this post, we won't get into the more complicated strips, but will address some of the more common ECG abnormalities you may see in your patients. There are a variety of causes that can contribute to these abnormalities.
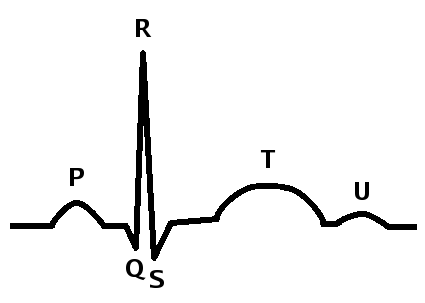
One cardiac cycle on an ECG.

Electrical impulses through the heart.
Heart Rate (Normal: 60-100 beats/minute): The number of times that the heart contracts (or beats) in one minute. The first image above shows one complete electrical cardiac cycle. When assessing an ECG strip, measure from one R wave to the next R wave. Do this between multiple heart beats. If they are all the same distance, the patient is in a "regular" rhythm.
P Wave (Normal: less than 0.12 seconds): This is the first electrical impulse in the cardiac cycle. It shows the atria depolarizing and contracting. The first electrical impulse for the heart is generated at the sinoatrial (SA) node which then depolarizes the atrial cells and causes them to contract. This pushes the blood from the atria into the ventricles.
- If abnormal: This could be due to the patient being hypokalemic (potassium levels low). Check a potassium level! If the P wave is longer than 0.2 seconds, the patient is in a first degree heart block. An abnormal P wave is also seen with a patient's heart is in atrial fibrillation or atrial flutter. In both of these arrhythmias, you can see that there is not a QRS complex after each P wave (like in normal cardiac physiology). The electrical impulse in the SA node essentially gets stuck in the atria and keeps signalling and signalling the atria to contract, hence lots of P waves.

QRS Interval (normal: 0.8-0.1 seconds): During this electrical phase, the ventricles are depolarizing (contracting) and the atria are repolarizing (resting). The QRS shows the electricity moving from the AV node through the Bundle of His down to the Purkinje fibers at the base of the heart. The ventricles are squeezing the blood out of them. The reason the blood does not go back into the resting atria is because of the valves between the atria and ventricles are shut and do not allow the blood to back flow. This pushes the blood out of the pulmonary and aortic arteries.
- If abnormal: If the QRS interval is longer than 0.12 seconds, this may indicate that the patient has a bundle branch block (BBB). There are two different types of BBBs: right and left. The type of BBB is determined by which side of the heart the electrical impulse is not flowing correctly through. On the image above, you can see the bundle branches in the septum between the ventricles. For example, if the electrical issue is in the right bundle branch, you see a right BBB.
T wave: This is the time period of ventricular repolarization (or relaxation). The time between the S wave and T wave is called the ST interval. This is the time period between ventricular contraction and relaxation.
- If abnormal: If the ST interval is elevated, this can be indicative of a myocardial infarction (heart attack). If the ST interval is missing altogether or depressed, it may be showing myocardial ischemia (inadequate blood flow to the heart muscle).
U wave: This wave is not always seen on an ECG strip because it is very small. This is thought to be the repolarization of the Purkinje fibers.
Resources